A couple of weeks back, I explained the historic importance of economic growth, and more particularly disposable income growth, in predicting presidential election results. When incomes are rising, incumbent parties tend to get reelected. When they are static or falling, incumbent parties tend to lose.
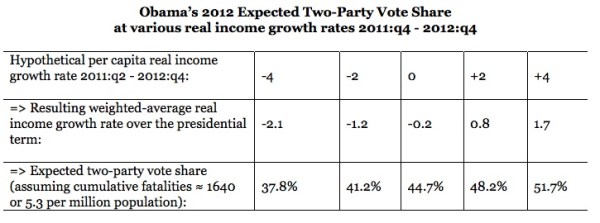
On Monday, the Bureau of Economic Analysis released December’s income growth rate. It is modestly better than the month of November, an increase from negative 0.1% to 0.3%, but still basically flat. So what does that mean for Obama? Nothing particularly good. Last fall, economist Douglas Hibbs Jr. ran the numbers, predicting sort of growth that Obama needs to be in a comfortable margin of victory by historic standards. It looks like this:
There is still time. Hibbs is calculating quarterly data, and December is just a month, with some momentum behind it that could continue into the Spring. It is also true, following Hibbs’ calculations, that economic changes closer to Election Day matter more than those further away, so each subsequent month will be more important than the last.
But the most recent data suggests that, on the economy alone, Obama is tracking more towards a 45% popular vote share than a 50% popular vote share, if historical patterns hold. Of course, such calculations do not determine a candidates fate, and there have been campaign cycles, namely 1996 and 2000 that do not fit the pattern. But the new numbers do show the headwinds Obama faces. Unless growth continues to increase monthly, he will have to significantly outperform historic expectations to win.
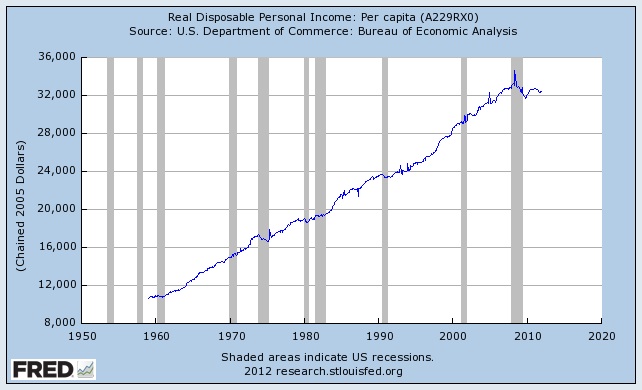
To get a sense of just how badly the latest economic troubles have hit voter pocket books, here is a chart from the St. Louis Federal Reserve, showing changes in real disposable personal income since 1960.
The line has a nice steady incline, neatly capturing an American populace that is accustomed to increases in disposable income over time. But note the flattening that occurred around 1980 and again around 1992. In both cases, the incumbent presidents, Jimmy Carter and George H.W. Bush, lost reelection.
Obama optimists can take comfort in the direction of the line around 2000. Gore, representing the incumbent party, should have won big. But he effectively drew a tie in the popular vote. In other words, this line is not always right. More often than not though , it is.


